Follow Us On:
![]()
![]()
![]()
Follow Us On:
![]()
![]()
![]()
- Positive Response to NAHB Contracts, Documents & Forms Launch
- NAHB Contracts, Forms & Documents Now Available
- Annual Installation and Recognition Reception
- Safety Consultant Finds Rewarding Work in Keeping Others Safe
- Call for Entries NOW OPEN for the 2016 CARE Awards
- 2017 All Council Kick Off Event January 26 2017
- Highlights from NAHB Mid-year Board Meeting from RubinBrown
- It's Time to Thank a Framer
- Dedication to Safety Pays Off for Boulder Creek Neighborhoods
- NAHB approves Professional Women in Building Charter for Denver HBA
- NAHB Now | Codes Voting Tool Saves Time and Money.. It Just Needs Voters
- Trade Association Partner of Colorado Real Estate Journal's 2016 Residential Land Development Conference
- HBA of Metro Denver and Colorado Construction Institute create Construction Apprentice Program
- Jack Fisher Homes takes over Henry Walker Communities
- Builder Confidence Rises in August
- Colorado ranks 6th for lot production in second quarter
- Industry Night was once again a huge success!
- Impressive Industry Night Opens 2016 Parade of Homes
- Case-Shiller: Home price gains slow nationwide; Denver hits new price peak in June
- Successful 28th Annual Parade of Homes
- Governor Appoints HBA Member to Blue Ribbon Oil & Gas Task Force
- TriPointe Challenge for the HBF
- 2014 Colorado Compensation Guide
- The "Stand-up Economist" Dr. Elliot Eisenberg
- 2014 Denver MAME Awards
- 2014 HAP Award Finalists Announced
- Denver’s best home builders are honored at HBA’s general membership meeting
- Home Builders Foundation Annual Luncheon
- Recap - Home Builders Foundation Annual Luncheon
- 2015 Sponsorship Information Announced
- Driving a Vibrant Economy: Housing's Role in Colorado's Economic Success
- Economic Impact Study
- Colorado Construction Institute (CCI) Addresses Projected Construction Labor Shortage
- Housing Squeeze
- Impressive recognition at upcoming IBS by our local HBA members
- Executive Suites Available
- Office Space Available Immediately
- Member Advantage Breakfast
- Certified New Home Sales Professional (CSP)
- President's Letter to Members
- Denver’s Home Builders Association appoints first female president in its 73-year history
- See the (C.S.P.) Competition
- NAHB "It Pays to be a Member"
- Denver Sales & Marketing Council brings home the Gold
- And the Award Goes To...
- Professional Women in Building Inaugural Event
- 1st Quarter Member Advantage Breakfast
- OSHA 10-Hour Residential Construction Safety Course
- PWB Host Inaugural Event
- Best in American Living Awards
- Congratulations to the NAHB Safety Professional of the Year!
- HBA Metro Denver Associate Member/Author Shines at IBS 2015
- Jackson Design Build Featured in Denver Post
- 2015 Parade of Homes Informational Meeting Scheduled Wednesday, February 25th, 8:00am
- Colorado Legislators Need to Fix Barriers to Attainable and Affordable Homeownership Rents Soar and Condo Construction Stalls, creating “Housing Squeeze”
- Professional Women in Building Inaugural Event Draws Some of Industry's Best
- Remodelers Council and 55+ Housing Council presents a Lunch & Learn on February 19th
- City of Lone Tree OKs Ordinance on Construction Defects
- “Not everything that happens in Vegas stays in Vegas” “The best ideas from the International Builder Show in Vegas showed up in Denver Colorado today!”
- PWB Connections and Cocktails - March 19th!
- This Year Marks Denver's 30th Anniversary of the Parade of Homes
- 2nd OSHA 10-Hour Residential Construction Safety Course Scheduled
- Godden/Sudik Architect publishes article in Professional Remodeler Magazine
- FBC to feature John Covert on March 24th
- HBA member Michael L. Woodley inducted into CHF Hall of Fame
- Premier Event Builder Product Expo - April 9th
- Builder Product Expo - April 9th
- Join HBA and OSHA in National Safety Stand-Down May 4-15th
- HomeAid
- HomeAid | 2016 Rebuilding Lives Breakfast
- Professional Women in Building Council
- Construction Defects Reform Bill Passes in Senate Committee
- National Award Winning Denver SMC Hosts Annual Kickoff
- PWB Connections & Cocktails - March 19th!
- Invitation to Playbook for Denver's Construction Labor Pipeline
- Parade of Homes – Home Entries Due Soon
- MHC Gears Up For Denver Candidate Interviews
- SB177 WILL LIKELY BE HEARD BY THE FULL SENATE ON FRIDAY, APRIL 10TH
- Flatirons Building Council presents a promising outlook for homebuilding in Denver and Boulder
- NAHB Now, Feds Want Higher Efficiency Standards for Furnaces
- NAHB Now, A Housing Market Gut Check
- "Prices of homes in Colorado rise at fastest rate in nation"
- 2015 Parade of Homes Industry Night Location Revealed!
- NAHB Now, FHA Single-Family Housing Policy Handbook
- Construction-Defects Bill Gets Green Light in Senate
- EPA Honors Wonderland Homes at 2015 Energy Star Partners of the Year
- Executive Suites Available
- ON TO THE HOUSE: Ask Your Representative to Support SB177
- Metro Housing Coalition Political Committee 2015 Denver Election Guide • Endorsements
- Wetlands Case Ruling May Prove to be Beneficial for Home Builders and Developers
- Boise Cascade Announces Retirement of Long-Time Manager
- Auction.com Names Denver Top Single-Family Housing Market
- HBF LOOKS TO RAISE $10,000 TO FUND A LIFT FOR A BOULDER CHILD
- Don't miss Connections & Cocktails Tuesday April 28th
- AMC Presents CFPB RegulationS Lunch & Learn
- Home building contributes to a vibrant economy for both Metro Denver and Colorado
- Goodbye HUD-1 Form. New Home Closing Rules Take Effect Aug. 1
- Six House Dems Snub Affordable Housing Groups-Kill SB177
- Colorado lawmakers spurn the condo market
- Case-Shiller: Denver Home Prices Accelerated The Fastest in February
- Help Stop the Newest Regulatory Overreach From the EPA
- Home Builders Association’s first female president is guest speaker at Colorado Women’s Chamber of Commerce
- Play it Safe During National Safety Stand Down Week
- Efforts to tackle Colorado's affordable-housing crisis fail in Legislature
- NEW HOME SALES LOOK PROMISING FOR REST OF 2015
- Littleton passes construction-defects ordinance
- Spring General Membership meeting – Tuesday, May 19th
- OSHA 10-Hour Residential Construction Safety Course
- Denver Post Editorial
- HBF - Grapes & Galleries
- SMC: May 18th! What do Diverse Communication Styles and Wine Have in Common?
- NAHB: Help for Remodelers, Consumers from House Lead Paint Bill
- Field Focus 4 Safety Training
- 9NEWS: Denver's Housing Market catching national interest
- CNBC Realty Check | Denver housing: Rocky Mountain high and HOT
- Builder | THE SURGE IN STARTS: METROSTUDY PINPOINTS SEVEN FAST-GROWING MARKETS
- NAHB Overview of the OSHA Confined Spaces in Construction; Final Rule
- EPA full steam with 'Waters' protection rule, but trouble ahead
- NAHB: EPA’s Final Water Rule Could be Headed Back to Court
- NAHB Now | NAHB Continues Fight for Better Codes
- PWB Supports HomeAid Colorado Essentials for Young Lives Drive
- Labor Task Force Graduates Available
- Construction Boom Update: Wages Exceed National Averages
- Candidates Wanted! 2015 Summer Job Fair - June 19th - 11:00 AM to 6:00 PM
- 2015 Summer Job Fair - June 19th - 11:00 AM to 6:00 PM
- Member Sponsored, Industry Related Events & Announcements NEW on HBADenver.com
- Denver Post: Not a lot of lots in city
- 60 Design Trends In 60 Minutes - June 18, 4-7 PM
- SMC 2.0 Leadership Program - July 13, 8:30-11:00, @ Terrain by TRI-Pointe
- PWB June Connections & Cocktails
- Buying the Experience - Presented by Jeff Shore
- Safety a Top Priority for Shea Homes
- NAHB Helps EPA Simplify Stormwater Permitting Process for Small Builders
- CARE 2015 - Call For Entries
- Steps to Make the Most of Your HBA Membership
- National Recognition for Local PWB
- NY Times | Ryland-StanPac to Merge
- Denver SMC becomes one of the first in the country to bring the new MIRM designation to Colorado
- KB Home Spies More First-Timer Home Buyers
- Sterling Ranch finally under way
- Will major home building merger trigger industry-altering trend?
- Last Chance to Get Your Questions Answered About MIRM
- The HBF Teams Up with Wells Fargo & the National Multiple Sclerosis Society To Build A Ramp
- 7th Annual Grapes & Galleries Raised Over 70K for the HBF
- 2015 Gold Nugget Awards Presented
- Housing's Labor Crisis Worsens
- WSJ | The New Job Advice: Put Down the Machine Tool, Pick Up the Hammer
- PWB Council Supports Hike for HomeAid
- HBA of Metro Denver opens registration for the 2015 Parade of Homes Industry Night
- Bidding Wars Back for Homes
- MHC Political Forum - You're Invited! September 30th
- Denver's PWB Recognized at PCBC
- Parade of Homes Announces Major Sponsors for 2015
- Another Colorado city passes construction defects reform ordinance
- DENVER'S PERMIT PROCESS:
Frustration over long waits builds for contractors, do-it-yourselfers - Sales & Marketing Council (SMC) 2015 Membership Drive!
- Cities can't wait for lawmakers
- Team PWB's Hike for HomeAid Raises over $2,000
- 2015 Parade of Homes begins TODAY!
- Professional Women in Building Council's Empowerment Luncheon
- Earn All of Your CEUs at the EEBA Conference
- What's Happening Day One of the EEBA Conference?
- The Colorado Statesman | State Water Plan Updated, More to Come
- Meet Jim Bowlby | Stormwater Committee Member in the Spotlight
- Meet Peter Benson | MHC Board Member in the Spotlight
- Meet Aaron Foy | Government Affairs Committee Member in the Spotlight
- Denver HBA Implements New Initiative to Overcome Labor Shortage
- 10 Trends Defining The Construction Industry
- 2017 HAP Award voting is underway!
- It Takes 22 Subcontractors to Build the Average Home
- Builders: New NLRB rule could 'cripple' construction industry
- Reserve your spot today for the HBA Fall General Membership Meeting – it’s an event you won’t want to miss!
- Aurora council unanimously backs construction defects reform in favor of homebuilders
- The best remodelers are honored at the 2015 CARE Awards
- Metro Housing Coalition Fall Election Recommendations
- Need new Labor Solutions for Work in Trades? The HBA Construction Skills Development Initiative is here to help!
- Here’s Where All the Construction Workers Went
- Corps Sheds Light on Plant List
- 2015 HAP AWARD VOTING EXTENDED TO OCTOBER 9TH
- Oakwood Homes CEO selected as DBJ's Corporate Citizen of the Year
- Don't miss Flatirons Building Council's 60 Design Trends in 60 Minutes Nov 5th
- Education Opportunity - Customer Service
- Metro Denver HBA University Accredited - Customer Service
- Your MHC Fall 2015 Election Guide
- Professional Women in Building Council Membership Drive
- A Micro Overview of the 55+ Market with Mike Rinner and John Covert
- Local homebuilders launch Epic Homes with unique christening and groundbreaking event
- HBA Board of Directors Approves Dues and Assessment Cap Increase
First increase in nearly 10 years - Arvada Council Amends Code in Response to State's Failure to Address Construction Defects Reform
- Court Halts Waters of the U.S. Rule Across the Country
- Crossville Acquires CAPCO Tile & Stone Distributorship
- Denver Sales and Marketing Council celebrates their best at 2015 MAME Awards
- Why the Name Change?
- 2015 HAP Finalists Announced
- Denver council's first vote for construction-defects reform law is unanimous
- LABOR SHORTAGE PINCHES HOME BUILDERS
- Denver City Council votes 12-1, Passes Construction Defects Reform
- Denver HBA and OSHA recognizes Shea Homes with prestigious Master Builder Award
- Craig Campbell named 2016 president of Home Builders Association of Metro Denver (HBA)
- 2015 MHC Political Forum
- Sterling Ranch, Colorado announces major lot sale in Providence Village
- Professional Women in Building Shows Impressive Growth
- Outstanding Members Recognized at Annual Installation & Recognition Reception
- Welcome Craig Campbell and 2016 Board of Directors
- Local Industry Icon S. Robert August Named One of NAHB's Outstanding Educators
- Shea Homes receives two distinguished safety honors
- SHEA HOMES ACQUIRES 1,270-ACRE PARCEL FOR NEW MASTER-PLANNED COMMUNITY IN NORTHERN DOUGLAS COUNTY
- The HBA Welcomes Our Newest Members!
- Massive increase in construction jobs in Denver over past year
- 10 construction industry trends to watch in 2016
- 6 New Year's resolutions for construction managers
- Homebuilder and Remodeler Cost Breakdown
- FEMA Must Get its Flood Remapping Process Right
- Denver HBA members to be featured presenters at the 2016 International Builder’s Show
- Denver HBA members honored with peak designations at 2016 International Builder’s Show
- Denver PWB Recognized as largest, most outstanding PWB Council in the US
- New Appraisal Guide Helps Boost Green Home Valuations
- Let’s welcome our newest group of HBA members!
- Local HBA Members Win Big at 2016 International Builder Show
- How to Get a Premium for Your Energy-Efficient Home
- OSHA Silica Rule Moves One Step Closer to Becoming "Law"
- HBA Councils Kick-Start 2016 with New, Exciting and Informative Programs
- NAHB Honors Robert August as 2015 Sales and Marketing Educator of the Year
- February Member Advantage Update
- David Miles: 2016 Legend Award for Excellence in New Home Marketing
- BREAKING NEWS: NAHB Moves Needle on EPA Online Lead Paint Training
- Join us March 3rd for a special presentation from Marcel Arsenault
of Real Capital Solutions - New HBA Job Board provides direct access for positions within the construction industry
- REColorado Working With Denver Homebuilders
- PROMINENT METRO DENVER HOME BUILDING COMPANY ANNOUNCES SUCCESSION PLAN TO TAKE THE COMPANY INTO THE NEXT GENERATION
- Flatirons Building Council presents an optimistic outlook for the home building industry.
- 165 townhouses to be added in Stapleton priced at less than $200,000 each
- Profits Matter: Which Remodelers Make the Most
- Metro Denver short of “starter” homes
- Home Builders Foundation Blitz Build Scheduled Aug. 25-27
- Meet Epic Homes, Denver’s newest hometown builder Public Grand Opening: April 2, 2016
- Membership continues to grow at the Denver HBA!
- New Members Participate at Industry Night
- KEPHART Announces New Associate Principals
- Metro Denver HBA University | The Impact of the Current Litigious Climate on the Homebuilding Industry
- Zillow: Restrictive land regulations exacerbating tight housing inventory, rising rents
- The many faces of Stapleton - Steve Phua and family
- HBA Teams Up With OSHA - Events Scheduled for 2016 National Safety Stand Down
- First Group of Home Builders Join 2016 Parade of Homes
- Reach Your Goals with Metro Denver HBA University
- Apply Now for PWB Educational Scholarships!
- Colorado’s construction industry in need of more workers
- Eight more home builders join 2016 Parade of Homes
- Regulation: 24.3 Percent of the Average New Home Price
- Construction-Defects Transparency Legislation Stalled in 2016
- BUILDER MAGAZINE'S 2016 BUILDER OF THE YEAR: CALATLANTIC GROUP
- HBA Lobbyist Mary Kay Hogan Rescues Metro District Financing
- H&H Builders recognized in Remodeling Magazine's 2016 Big 50
- More People Than Places
- All hands on deck for Colorado housing crisis
- NAHB Releases Remodeling by Zip Code Estimates for 2016
- Supreme Court Issues Common-Sense Wetlands Decision
- 5 crucial issues impacting the construction industry
- Terrain in Castle Rock will host “Industry Night” to kick off the 2016 Parade of Homes
- Colorado Job-Ready Students initiative advances training within the construction industry
- Flatirons Building Council features a panel discussion of big builder verses small
- NAHB-Supported Senate Bill Would Reform Federal Housing Programs
- SMC Hosts Customer Service Expert Carol Smith on July 11
- John Stevens, Sopris Homes earns Graduate Master Builder designation
- August 1 Deadline for National Remodeler Awards
- Remodeling Activity Up for 13 Consecutive Quarters
- 3rd Quarter Eye Opener Breakfast
- CARE Awards – Last Call for Entries, Tickets on Sale!
- See 60-plus new model, custom and luxury homes for free
- WORK Act Promotes HBA-CCI Skills Training Programs
- 2nd IRC Update Announced
- Don't Miss MAME's FINAL August 10th Deadline! Enter Today!
- HOME BUILDERS FOUNDATION BUILDS 17 RAMPS IN THREE DAYS
- Metro Denver builders ramp up home starts, but mostly on high-end models
- City of Denver Adds $1.3 Million to Expedite Permitting Process
- JWilliams Staffing Announces Colorado Francise Leadership Transition
- Shea maintains Master Builder status for second consecutive year
- 2016 Safety Fair - Advancing Safer Work Places
- FHA Extends Condo Project Approval Policy
- 2016 Denver Parade of Homes’ Magazine Goes Interactive
- Metro Housing Coalition 2016 Political Forum September 28th
- Save the Date - Metro Housing Coalition 2016 Political Forum September 28th
- 2016 Parade of Homes enters final weekend
- MEMBER MQ ARCHITECTURE & DESIGN NAMED OCTOBER NAHB REMODELER OF THE MONTH
- What's Holding Back the Housing Market? Not Enough Construction Workers
- Cheryl Schuette Named 2016 MAME Legend Award Winner
- NAHB Releases Construction Liability and Risk Management Update
- New-home building badly lags demand created as new jobs are added in metro Denver. Shortage becomes chronic as builder-defect laws remain unresolved, labor is short
- Supreme Court hands down a decision in favor of Pulte Homes
- Village Homes Unveils 700 Home Community
- 2016 MHC Election Recommendations
- Home Builders Foundation of Metro Denver Provides Accessible Home Modifications For One Of Its Own
- 2017 HAP Award Finalists Announced
- Top 40 Code Change Proposals for 2016
- NAHB Makes a Case to Streamline Code Development
- Metro Denver HBA University Fall/Winter Education Opportunities
- KB HOME NAMES MATT MANDINO REGIONAL PRESIDENT
- Best Builders in Denver as voted by Associate Members' HAP Award
- Fall Festival Fun: Professional Women in Building Council Helps Hope House Celebrate
- Professional Builder Accepting 2017 "40 under 40" Nominations
- Purchase your IRR Tickets TODAY!
- Award Winning Efforts!
- Building together: Women in construction look to each other for support
- Metro Denver Custom Builder & Remodeler Council to be awarded NAHB Remodelers Small Council Membership Contest
- 2017 Board of Directors Installed December 7th
- Tina Martelon-Braunthal - 2016 Volunteer of the Year
- KB Promotes Randy Carpenter to Colorado Division President
- Michael Smith - 2016 Associate of the Year
- Thought Leader: Buz Koelbel leads developer interest in affordable housing
- Become NAHB's Remodeler of the Month
- Gene Myers of Thrive Home Builders named HBA Home Builder of the Year
- Sales & Marketing Council Unveils 2017 Program Lineup
- Holiday Deals for HBA Members from National Purchasing Partners
- RMG – Rocky Mountain Group Acquires CRE Design Engineering
- Consilium Design Awarded the Best in American Living (BALA) Gold Award
- ANGELA HARRIS HONORED WITH HBA OF METRO DENVER’S FIRST “ICON AWARD”
- Denver SMC wins Best SMC Award at Nationals
- Legends of Residential Marketing 2017 Honoree - S. Robert August
- NAHB: 55+ housing market set to grow over the next decade
- NAHB Recognizes Local and National Leaders in Residential Construction Safety
- Metro Denver Members and Councils Clean Up at IBS!
- Metro Denver Members Awarded BALA Awards
- Home Building Industry Icon, HBA Past President, Builder of the Year Recipient Phil Winn has passed
- Daniels College of Business students take second in national competition
- Daniels Home Builders Career Fair
- All Council Kick-Off An Inspirational Start to 2017
- BUILDERS OPPOSE SENATE BILL 45
- Denver area still lags in new home construction
- ACTION ALERT
- StrucSure Home Warranty Celebrates 20 Years Serving America’s Builders and Homebuyers
- CALL TO ACTION - Attainable Housing Day & SB-156 Press Conference Feb 27th
- ADVOCACY - Call to Action - EMAIL YOUR SENATOR
- Re-booted construction-defects reform passes 1st Colorado Legislature hurdle
- WOTUS - What's Next
- Home Builders Foundation 2017 Blitz Build
- Stay Up-to-date on Construction Defect Reform Efforts
- Breaking News - House Votes to Overturn OSHA Recordkeeping Rule
- SB 156 Construction Defect Reform UPDATE!
- Welcome Young Leaders Council (YLC)!
- 'No entry level housing options': Report paints grim picture of Boulder County affordability
- ACTION ALERT - TIME TO ACT!
- PARADE OF HOMES RETURNS FOR A 32nd YEAR SHOWCASING DENVER’S HOTTEST NEW HOMES ON THE MARKET
- Speaker Duran sings same old song on Construction Defect Reform,
Blasts business leaders, builders, and mayors - EPA's 2017 construction stormwater permit takes effect
- WHAT IS YOUR INSPIRATION?
- Pantone reveals 2018 color trends for interiors
- FIRST GROUP OF HOME BUILDERS AND DEVELOPERS JOIN 2017 DENVER PARADE OF HOMES
- OSHA to delay enforcing crystalline silica standard
- ACTION ALERT
- Common sense makes affordable housing
- The mouse that won't stop roaring
- Another Successful Builder Product Expo
- Breakthrough reached as business coalition, mayors throw support behind bipartisan construction defects bill
- Plans Announced for West Line Village 134 New Rowhomes At Sheridan Station TOD Site
- Bipartisan construction defect bill moves forward in Colorado
- 5 ways to keep homeowners safe when they visit the job site
- $1.1 Million of Influence
- HOA Coalition Commends the State Senate Business Committee for passing HB 1279
- CONSTRUCTION DEFECTS BILL CLEARS LEGISLATURE
- Colorado Real Estate Journal's 2017
Residential Land Development Conference May 24 - Get Ready for the 2018 IRC
- Colorado lawmakers let additional construction-defects bills die
- Round 1: What the latest Canadian lumber tariffs mean for US housing
- 2017 DENVER PARADE OF HOMES GROWING BY THE MINUTE WITH ENTRIES FROM BUILDERS AND DEVELOPERS
- LOCAL BUILDER/REMODELER NAMED NATIONAL ASSOCIATION OF HOME BUILDERS REMODELER OF THE MONTH
- HOME BUILDERS FOUNDATION COMPLETES STAFF EXPANSION
- HBA of Metro Denver Promotes Toby Paioff to Accounting Manager
- NAHB Targets the Good, the Bad and the Ugly Regulations
- High Impact Fees Put a Major Crimp on Housing Affordability
- Candidates & Employers Wanted! 2017 Summer Job Fair - June 22 - 9:00am to 1:00pm
- NAHB Releases Remodeling by Zip Code Estimates for 2017
- How CO builders are using technical training to fill the worker pipeline
- SUPREME COURT SIDES WITH BUILDERS ON VALLAGIO
- Young Leaders and Libations!
- Vallagio Decision Follows First Legislative Step on Construction Defects Reform
- 2017 Parade of Homes Industry Night Location Revealed!
- HOME BUILDERS FOUNDATION PARTNERS WITH LENNAR AND ACCESSIBLE SYSTEMS
- WOTUS Rule Definitions on the Way Out
- Home Builder Association's Chérie Talbert named DBJ Outstanding Women in Business Finalist
- BERKSHIRE HATHAWAY'S CLAYTON BUYS OAKWOOD HOMES
- Call for Legends Award Nominations
- THE PARADE OF HOMES IS TWO WEEKS AWAY!
- Builder Realty Council expands Parade of Homes Bus Tours to span 4 weeks
- Invest in your future
- DENVER PARADE OF HOMES AND AMERICAN FURNITURE WAREHOUSE ANNOUNCE #MYPARADEINSPIRATION SOCIAL CONTEST
- Denver’s apartment-building frenzy nears end – slowdown predicted in 2018
- New law says students must be told about skilled labor, military careers
- Denver buyers developing an attachment to townhomes as fewer new homes list under $400K
- Parade of Homes takes over with PR and Social Media
- Call for HBA Board of Director Nominations
- Oakwood Homes to take over as master developer of Reunion in Commerce City
- 2017 MHC Political Forum - September 27th
- CAHB announces departure of CEO Scott Smith
- A forceful and effective response to the Firestone tragedy
- ‘Connected’ Homes: Trends and Key Legal Issues
- Time to Build a Single-Family Home in 2016
- Starved For Workers, Colorado Construction Is Plugging The Gap With An Academy
- There’s Still Time to Save on Builders’ Show Registration
- Arguments begin in marathon court hearing over Lakewood growth
- Kicking Off Professional Women in Building Week 2017
- Hyperloop One names 4 potential US routes
- Foes of Lakewood growth-control initiative come out with dukes up
- 2017 Safety Fair -
- UPDATE FROM XCEL ENERGY
- Your Time is Now! 2017 Remaining Education Opportunities
- Mayor Lee orders San Francisco to build 5,000 new homes annually
- 2017 CARE Awards Recognizes best in the Remodeling Industry
- EPA Relaunches Smart Sectors Program to Collaborate with Industry
- MAME Finalists are Announced
- Home Builder Academy featured by Builder Magazine
- Doug Benevento appointed Region 8 administrator for Environmental Protection Agency
- Call for Nominations - HBA's Annual Awards Recognition
- 2018 Call for Nominations - HBA's Annual Awards Recognition
- 2017 Metro Housing Coalition Voter Guide
- Eliminate the Dust: Complying With the New Silica Standard
- Ground Breaking Announced for West Line Village
- Limited Time 10% + 2% Discount for NAHB Members from Lowe's
- CAHB Appoints Ted Leighty as Next CEO
- 2017 HBA Annual Meeting - Power Panel speakers announced
- DBJ Fast 50 — DIRC Homes finds the homebuyer's sweet spot
- DBJ Fast 50 — Lokal Homes builds with Colorado culture in mind
- Three top Denver builders honored at Annual Meeting with the prestigious 2017 HAP Award
- Photos of the 2017 Fall General Memberhship Meeting are here!
- Lennar, CalAtlantic Strike Deal to Create Largest U.S. Home Builder
- LENNAR BETS ON TECH TO MAKE CALATLANTIC COMBO WORK
- Denver construction permit values soar past $3B
- Desperate for workers, a Colorado homebuilder starts a free school
- Hard truths behind the housing shortage
- Colorado's Century Communities buys Seattle homebuilder
- MAME 2017 Celebrates the Toast of the Town
- Election 2017: Voters apply brakes to growth in Denver suburbs
- POLICY ALERT! Tax Plan
- MAME 2017 Event Photos Now Available
- Don't miss the 2017 Installation and Recognition Reception!
- HBA of Metro Denver members' work announced as Silver Award Winners for National Sales and Marketing Awards
- HBA of Metro Denver's Members Honored at Nationals Awards in Orlando
- Recap: Installation and Recognition Reception
- HOME BUILDERS ASSOCIATION OF METRO DENVER ANNOUNCES FIRST-EVER INNOVATIONS SUMMIT
- More on the cover story: Colorado's condo market is growing slowly after state's 2017 actions
- These Colorado companies have the highest percentage of women on their boards
- Lakewood’s West Line Village selling homes it hasn’t even built yet
- HBA Innovations Summit Announces Speaker Lineup for 2018 Event
- State of the Cities: Metro Denver mayors weigh in on growing pains
- Capitol Close Up 1-23-18
- Capitol Close Up 3-23-18
- Who should attend the 2018 Innovations Summit?
- Denver’s chronic housing shortage may peak this year, but the fix could take another decade
- New Program from Colorado Home Building Academy
- HBA/Denver JTF Mtg Notes * A Lot of New Information you will want to read!*
- Meyers Research issues monthly Zonda Market Report
- Two HBA of Metro Denver Members Inducted into BALA Hall of Fame
- Colorado Association of Home Builders Report
- HOME BUILDERS FOUNDATION TO HOLD ANNUAL PUCKS FOR POSSIBILITIES EVENT ON FEBRUARY 28, 2018
- Scott Moberg Elected President of Home Builders Association of Metro Denver (HBA)
- Southern Land Company Hires Denver-Area Development Executive Heidi Majerik; Acquires 400 Acres in Erie, Colo.
- Housing shortage pushes metro Denver buyers toward new homes, but builders can’t keep up
- 2018 Parade of Homes Call for Entries
- Home Builders Foundation to hold 25th Anniversary Celebration April 12th
- More Home Construction Finally On The Way For Colorado?
- Avast, Ye Owners: Don’t be a Music Pirate
- NAHB Remodelers News Alert
- WSJ: THE NEXT HOUSING CRISIS: A HISTORIC SHORTAGE OF NEW HOMES
- Affordable housing bill moves forward in House
- Kyle Johnston Rebrands Company, Named Winner of DBJ’s 40 Under 40
- Townhome development breaks ground this week in Sloan's Lake
- Capitol Close Up 3-27-17
- TRI Pointe Names DuPree Colorado President
- 2018 CARE Launch Party
- NAHB Weighs in on Building Code Proposals
- Parker master-planned community sells for $41 million
- NAHB Member Advantage can save members thousands in 2018
- HBA Intern selected to attend 2018 NAHB Residential Construction Symposium
- CSU Chancellor Emeritus to speak at Spring General Membership Meeting
- HBA Recognizes OSHA Fall Stand-Down Week
- 2018 HBA Builder Product Expo pics!
- CENTURY COMMUNITIES TAPS BULLOCH TO HEAD COLORADO DIVISION
- Silica Safety Enforcement Ramps Up at Construction Sites
- Home Builders Foundation Home Builders Foundation Raises around $150,000 through 25th Anniversary Celebration Event
- The single-family home is in danger
- Safe, Affordable Homes Win at Code Hearings
- CAN MUNICIPALITIES MAKE IT EASIER TO BUILD GREEN?
- 2018 CARE Awards Launch Party
- Amazon’s home automation platform now standard in new Lennar homes
- 2018 Small Business Award winner: TRIO Environments
- 2018 DENVER PARADE OF HOMES ANNOUNCES FIRST GROUP OF SPONSORS
- Sponsor a Story in the Commemorative 75th Anniversary Edition of the Parade of Homes Magazine
- CAHB Leaders Successfully Brought Housing Concerns to Congressional Delegation
- Forest Service Pledges Largest Timber Harvest in 20 Years
- CFRR Exec Committee Told 1% Growth Limitation a Non-Starter
- Activist withdraws initiative to limit housing growth in Denver area
- No on 66 Campaign Succeeds
- Aurora changing how fees are calculated for new buildings
- KB HOME SLIDES MANDINO INTO COO ROLE
- 2018 CARE Awards CALL FOR ENTRIES
- Colorado home builder, with new buy, says it's now in U.S. top 10
- MAME University
- Denver Momentum Persists
- DU Home Building Technology Study 2018
- Safety first and foremost
- Primaries Set Candidates for Major Statewide Races
- Denver homebuilder enters another hot West Coast market
- BROOKFIELD MOVES INTO CASTLE PINES VILLAGE
- Single-Family Production Will Continue to Gain Ground in 2019
- 3 Colorado housing markets among healthiest in U.S., report says
- KB HOME UNVEILS A NEW BRAND MARK: WHY THAT MATTERS TO HOME BUILDERS
- Regulated Utilities Committee
- Alisa Poncher: International Builders’ Show Ask a MIRM: Why The Nationals Matter
- TRI POINTE BRANDS SCORE BIG IN WORKPLACE AWARDS
- Permitting Committee
- Overburdened sewer system has new development on hold
- Brookfield and Forest City Announce Acquisition Agreement
- Capitol Close Up - Summer 2018
- Capitol Close Up - August 28
- Get Your Denver Design Fix at the 2018 Parade of Homes
- Is your Jobsite Ready for an OSHA Inspection?
- Final approach: Two decades in the making for Stapleton housing
- New condo development hits the market in Denver's Hilltop neighborhood
- Half of US Homes Built before 1980
- #MyParadeInspiration Week One Drawing Winner
- #MyParadeInspiration Week Two Drawing Winner
- #MyParadeInspiration Week Three Drawing Winner
- KB Home and Toll Brothers complete 2 recent HBF projects
- Your National Discounts and Local Member Savings: Current Offers
- Call for Nominations - HBA Board of Directors Builder candidates
- Denver Post Editorial Opposes Initiative 66's Growth Limit
- LAND PREPARATION AND INFRASTRUCTURE DEVELOPMENT UNDERWAY AT THE CANYONS BY SHEA HOMES
- 920-home residential community breaks ground southeast of Denver
- HOME BUILDERS FOUNDATION BUILDS 20 RAMPS IN THREE DAYS FOR DENVER METRO RESIDENTS IN NEED OF ACCESS TO THEIR OWN HOMES
- Richmond American Homes Debuts Second Design Center In Denver
- TRIO Continues Growth Streak with Acquisition of Design Lines, Inc.
- 2018 Colorado CARE Awards Finalists Announced!
- DENVER HOME BUILDERS’ POINT MAN, INDUSTRY VETERAN JEFF WHITON, TO RETIRE
- Final Call for MAME Entries
- MERITAGE TO DONATE COLORADO HOME TO PURPLE HEART RECIPIENT
- Four HBA Members named as finalists to DBJ's Fast 50
- CAPITOL CLOSE UP 9-26-18
- HBA Hires Katie Karpovage as Home Builders Association Membership Manager
- Heidi Williams chosen as Director of Government Affairs for Home Builders Association of Metro Denver
- MAME Finalists are Announced!
- 2018 CAHB Voter Guide
- 2018 Metro Housing Coalition Voter Guide
- 2018 CARE Awards Winners Announced!
- 2018 HAP Award Finalists Announced!
- OSHA Clarifies Position on Workplace Safety Incentive Programs and Post-Incident Drug Testing
- CAN UNCLE SAM BEAT THE NIMBYS?
- ZELMAN STILL SEES A PIVOT BACK UPWARD IN THE 2019 OUTLOOK -- SHE'S NOT ALONE: HERE'S WHY
- Chérie Talbert: The Future of the HBA Keynote
- Three top Denver builders are honored with the prestigious 2018 HAP Award
- Dorys DeMiranda joins the HBA as Education & Training Manager
- HBF finishes 2018 fundraising events with golf outing and luncheon
- New! Promo from National Purchasing Partners
- 3 Months FREE from ADP!!! Limited time discount offer from NPP
- Heidi Majerik Installed as 2019 Home Builders Association President
- HBF raises $25,000 Colorado Gives Day
- Paralyzed School Principal Receives $30K in Home Improvements from Home Builders Foundation and Sheffield Homes.
- Congratulations Annual Awards Recipients & 2019 HBA Board of Directors
- It’s Coming! All New for 2019!
![]()
![]()
NAHB Releases Remodeling by Zip Code Estimates for 2016
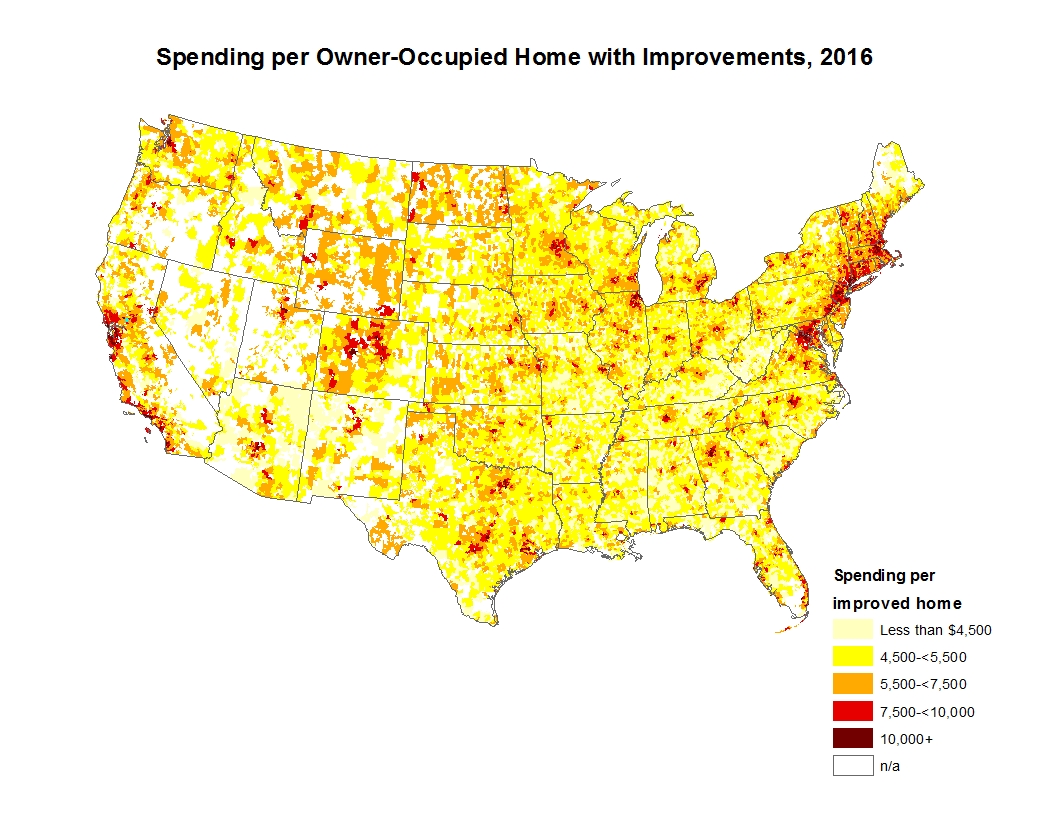
NAHB has released its latest projections of spending on improvements to owner-occupied housing by zip code. The projections show total spending on improvements, the number of owner-occupied homes, as well as average spending per improvement, in each zip code for calendar year 2016. Also shown for each zip are 2016 projections for the five key variables NAHB uses to estimate home improvement spending in relatively small areas.
The five variables are number of homes in the area, the share built in the 1960s, share built in the 1970s, owners’ average income, and their level of education. To illustrate how these variables interact, consider the four zip codes where spending per improvement is over $18,000 (compared to $5,800 for the average zip code). These four zips have relatively few homes built during the “sweet spot” for remodeling (between 1960 and 1980), but this is more than offset by home owners who are highly educated and have extremely high incomes. At the very top of the list... Read rest of the article
Tweet


Copyright 2014
Home Builders Association of Metro Denver